TPU Monitoring in MLFlow
Huge thanks to Google TPU Research Cloud for providing me with access to TPU chips!
MLFlow sadly doesn’t support TPU monitoring out of the box like with NVIDIA cards and pynvml.
Luckily it was very easy to add this feature with the following snippet:
def log_tpu_mlflow(step):
    chip_type, count, data = tpu_system_metrics()
    for tpu in data:
        for metric, val in tpu.items():
            if metric != "device_id":
                mlflow.log_metric(f"system/{chip_type}/{tpu['device_id']}/{metric}", float(val), step=step)


def tpu_system_metrics():
    try:
        import tpu_info
        chip_type, count = tpu_info.device.get_local_chips()
        data = tpu_info.metrics.get_chip_usage(chip_type)
        data = [{"device_id": d.device_id, "memory_usage": d.memory_usage, "total_memory": d.total_memory, "duty_cycle_pct": d.duty_cycle_pct} for d in data]
        return chip_type, count, data
    except Exception as e:
        print(e)
        return "no tpu detected", 0, []
Then from your training loop just call it periodically:
log_tpu_mlflow(step=step)
The only dependency is tpu-info.
After this, in your system metrics tab you will have:
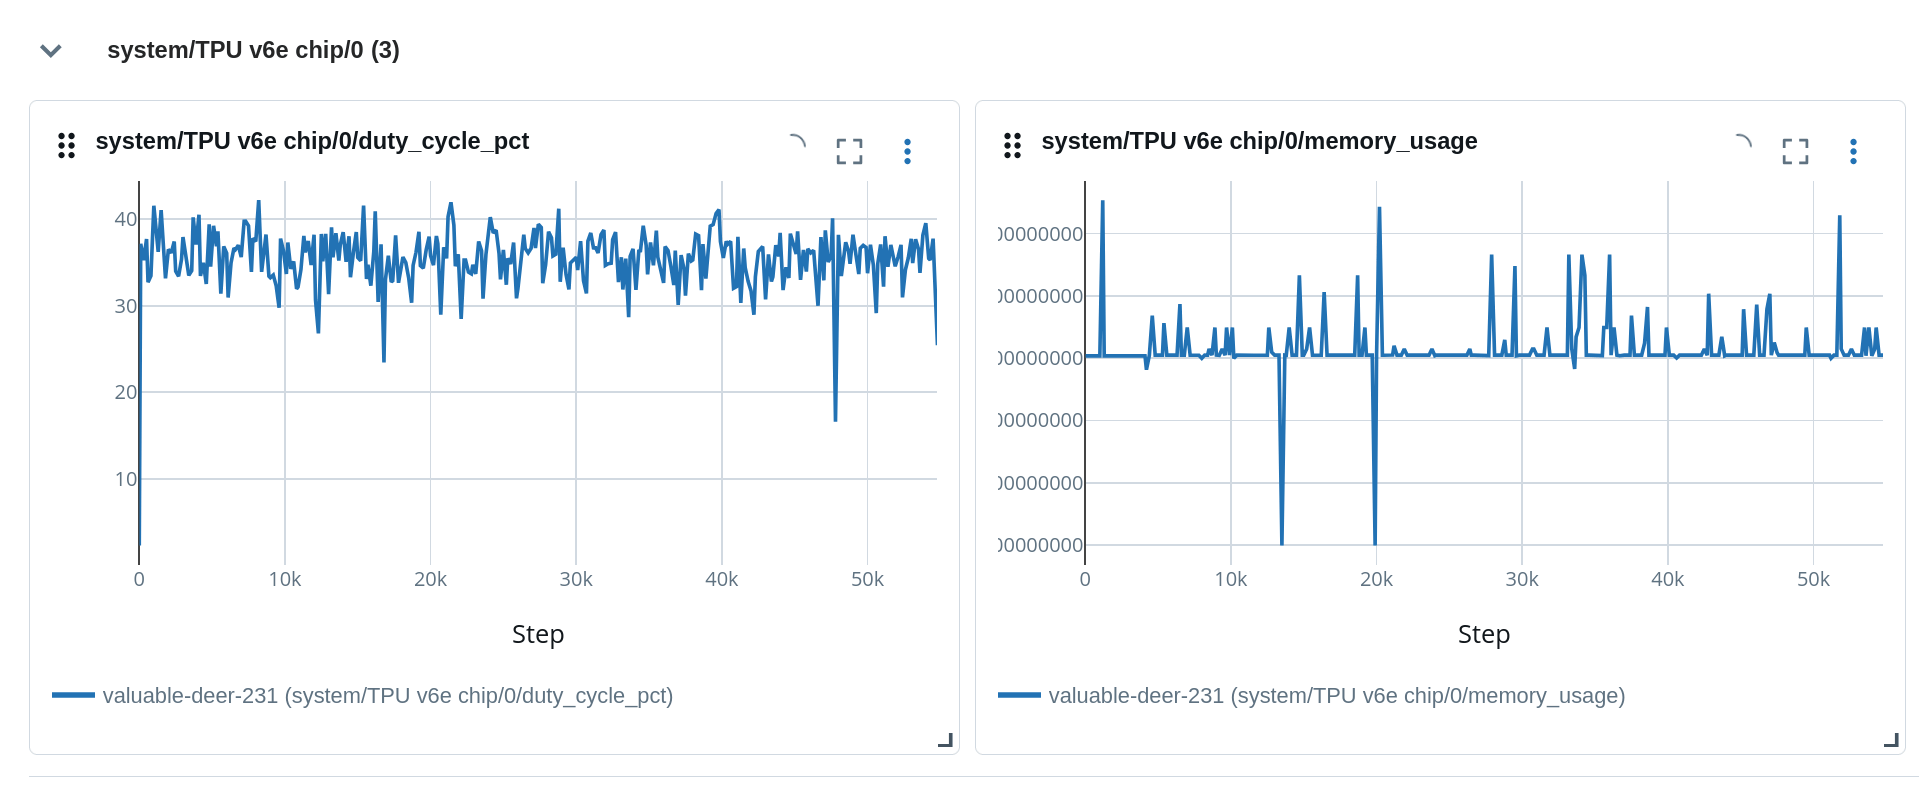
Very seamless and probably compatible with other experiment tracking tools, not just MLFlow!
I am not 100% happy with this solution, ideally it would be in a background thread. That would also help in a distributed training scenario. Keep an eye for a follow up post. :)
2
Kudos
2
Kudos